


Customarily the end of the year is filled with celebration and parties. However, more introspective personalities would also ponder the past year musing about good and bad moments. When it comes to the market, the Earth’s revolution around the Sun also defines the common practice of performance analysis. Thus, New Year’s Eve distinguishes winners and losers in the marketplace. Surely a common practice, but not a good one.
There is no apparent reason to determine the success of an investment based on a calendar year. Clearly, history is plenty of examples of industries and companies that rose to market Olympus in any given year, only to plummet to earth. Should it be driven by castle-in-the-air narratives or one-off burst driven by innovation makes little difference. The ensuing call to reality leaves investors with little solace. Many companies have been fallen victims to the “15 minutes of fame” Wall Street’s equivalent.
The situation makes me wonder what makes an investment successful and enduring?
It is our opinion that for a company to deserve the label of corporate success it must increase earnings at an above average rate for a long period of time and must earn an above average rate of return on its invested capital. The former recognizes that for a company to be considered worthy of attention it should increase its profit at a rate above what is deemed normal for the economy or the sector in which operates. There is nothing special in a company growing at 6% when the overall economy is at the same pace. Neither is the case of a business growing exceptionally due to a technological leap when everyone else is doing the same.
The other element – return on capital – is just as relevant. Growth is essential, but it cannot come at any cost. Generated growth should be related to the required investments, something that investors failed to grasp in the conglomerate mania of the late Sixties. As Alfred Sloan – the long-serving CEO of GM – plainly puts it: “The fundamental concern of a business is to earn a return on its capital”. Moreover adequate return on capital supplies the necessary resources to keep growing, thus avoiding the tedious enigma of external financing.
There is therefore an element of consistency in the definition of corporate success which can be summarized in the ability to grow earnings year after year at a satisfactory return on capital irrespective of the economic cycle.
In order to put into practice the maxim just elaborated we sift through the European market in search of corporates success in the period 2010-2021.To do so, we apply a simple screening made up of three basic rules: i) An operating income increase in every year of the analyzed period; ii) an average return on capital of at least 20% both for the period 2010-2021 and 2015-2021 and iii) an operating income increase of at least 5% yearly.
The results are quite impressive. Among the 1500+ listed companies which are part of the sample, only 9 companies abide to the rules set above. Let’s call them the Dream Team. They grew ~22x on average in the analysis timeframe, equivalent to an annualized return of 27% excluding dividends. Just for the sake of comparison, the Stoxx Europe 600 returned a meager 4% yearly over the same period. If this hasn’t shocked you, let’s make the case of an investor with 10,000 Euro in his pocket who had the choice between an indexing strategy and the Dream Team – gift of foresight included. The passive indexing would have reaped 15,400 Euro against 151,100 Euro for the Dream Team basket, a staggering +882% for the same 10,000 Euro initial investment. You can find the complete list in the Appendix 1.
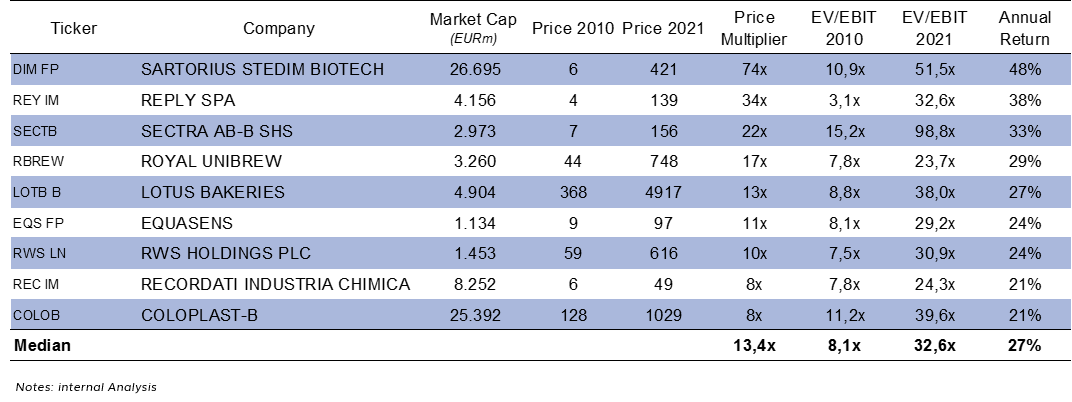
Under a valuation perspective, the Dream Team traded at a relative low multiple at the beginning of the period under analysis. The P/E multiple was below 9x. One could argue that 2010 was quite a depressed year after the fallout of 2008. Even accounting for this, it remains that the Dream Team was trading below the ~13x multiple for the whole market. Great and expensive are not always synonyms. Clearly, 10 years later investors came to reward the fundamental growth with higher valuation.
At the end of the analyzed period, the Dream Team multiple rose to 32x, substantially above the average market. Thus, current investors benefited from the virtuous effect of rising corporate profits and richer valuations.
But what are the underlying characteristics of corporate success?
It is worth noting that the Dream Team is quite heterogeneous, including companies like Sartorious Stedim Biotech – a company involved in laboratories technologies and equipment – and Lotus Bakeries – a confectionery producer. But, according to our analysis, there are two factors that are commonplace, are worth mentioning and are difficult to miss in investigating the cluster. These are the perishable nature of products or services offered and the presence of a controlling shareholder.
By way of example, Royal Unibrew is the epitome of a consumer discretionary business and Coloplast offers worldwide its ostomy products which are by nature inevitably replaceable. The same two companies have controlling shareholders. The brewer company boasts 15% ownership from Chr. Augustinus Fabrikker – the Danish foundation – since 2009. In the case of Coloplast, the ownership structure dates back to its foundation. The heirs of the founder still own more than 30% of the shares and the majority of voting rights.
At this point one could stop and wonder what would have happened with looser parameters in the selection of our Dream Team? In fact, we acknowledge that 11 years is quite a long period. So, companies could have been prey of plain bad luck and excluded from our Dream Team. Thus, we relaxed the rule i) an operating income increases in every year of the analyzed period allowing one or two years of negative growth. We name those two cluster 1 and cluster 2 respectively. Clearly, as we move to looser parameters, the number of companies identified increased. Cluster 1 numbers 26 companies while Cluster 2 stands at 52 companies. The results are synthetized in Appendix 2. Effectively, the return obtained by the three basket is decreasing with the relaxed rules. The 28% annualized return obtained by the Dream Team dropped to 17% in the case of Cluster 2.
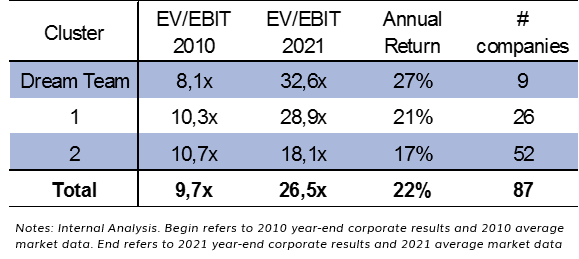
In terms of valuation, Cluster 1 and 2 – quite surprisingly – commanded higher multiples than the Dream Team at the beginning of the timeframe. Moreover, at the end of the period the discrepancy in valuation recognized by the market is quite significant. Cluster 2 meager 18x multiple pales in comparison to the ~30x for the other baskets. The Dream Team and the Cluster 1 came close in terms of market valuation. Apparently, investors shrugged off a negative year as bad luck. But no more. Two years of negative growth were taken as evidence of a volatile business.
Another technical factor for those of you that do not like averages in a world dominated by extreme volatilities is the distribution of performance in any given cluster. In practice, dispersion of performance rises with looser parameters. Cluster 2 contains companies whose performance is not far away from that of the broader market. Meanwhile Cluster 1 has companies whose returns are above companies in the Dream Team. At the end, a negative year could be really bad luck or a necessary step in the company’s evolution. Think for example, the R&D or OpEx required to discover or launch a new product. Those will inevitably affect the operating result of the business. More often than not, advancements take big leaps instead of moving in a straight upward line.
It is worth noting that the investor capable of selecting the right companies in Cluster 1 and 2 would have produced equally amazing investment results. It is also our opinion, that outstanding companies reside outside the Dream Team. The mechanical application of a defined set of rules becoming a substitute for thought rather than an aid to thinking should be avoided. In fact, for the sake of transparency, a pure selection based on performance offers a basket of companies made of a mix of the best companies in the Dream Team, cluster 1 and 2. To be fair, a few other companies appear which are not part of any basket.
Up until now, and looking at the example offered, the layman would rightly wonder where the large blue-chips end up. To be fair, few appear in our selection. Hermes, Novo Nordisk and LVMH are among the few large well-known companies appearing in our baskets which are worth mentioning.
In all other cases, despite their resounding names, the business of blue-chips have faced a myriad of obstacles which have made the investment undesirable for a long-term investor interested in buy-and-hold strategies. Conversely, most of the gain would have been probably made in capitalizing their erratic fundamental and market performance.
Conclusion
It appears – from our analysis – that a simple set of rules could generate eye-popping results for the investor capable of buying right and holding for the long term. So, where is the catch? The investigation is an exercise with the benefit of hindsight. The investor would have been really rewarded only in identifying those corporate successes in advance. We believe that stock prices follow corporate results in the long run. But what we came to learn is that consistency in results is eventually recognized by the market, which translates in a higher multiple. So, investors were really rewarded handsomely by the identification of the right companies at the right price.
Likely, the determinants of success are a mix of exceptional management, brilliant strategy execution, continuous innovation and other factors which made possible to deliver results above the reference market. But, are those opportunities now gone? Nowadays, investors should be willing to buy at higher price for those same companies thus reducing prospective returns. Still, the ability to grow earnings consistently could make the selection of those companies a good investment for the foreseeable future. Notwithstanding, investors have to give up the extra reward coming from multiples expansion and see their margin of safety significantly reduced.
Most likely, the corporate success of the future – those capable of exceptional returns for the wise investor – resides underneath the radar of what is now deemed trendy.
NOTICE: DOCUMENT INTENDED FOR SPECIALISED PROFESSIONAL INVESTORS ONLY
The information in this document does not constitute or form any part of, and should not be construed as investment advice or an offer, invitation, inducement or solicitation to sell, issue, purchase, subscribe for or otherwise acquire shares or other securities, or engage in investment activity of any kind nor shall it or any part of it form the basis of, or be relied on in connection with, any contract therefore. Only the latest version of the fund’s prospectus, regulations, Kiid, annual and semi-annual reports may be relied upon as basis for investment decisions. These documents are available on www.tendercapital.com, together with our ESG Policy & SFDR Statement. Information, opinions and estimates contained in this document reflect a judgment at the original date of its drafted and are subject to change without notice. Past performance is not a guarantee and it is not a reliable indicator of future results. Performance data does not include the commissions and fees charged at the time of subscribing for or redeeming shares, and the historical statistics are calculated over a minimum of 5 years or less in connection with the date of the lunch of the fund. In any case the performance consider a period of one year. Tendercapital Ltd is authorised and regulated by the Financial Conduct Authority (Registration nr. 540893). Tendercapital Funds Plc and Tendercapital Alternative Funds Plc are authorised and regulated by Central Bank of Ireland (Registration nr. C110112/ C110730).